Plots AFM line
AFM.linePlot(obj, no = 1, dataOnly = FALSE)Arguments
- obj
AFMdata object
- no
channel number
- dataOnly
if
TRUEno graph is returned
See also
Examples
filename = AFM.getSampleImages(type='ibw')
d = AFM.import(filename)
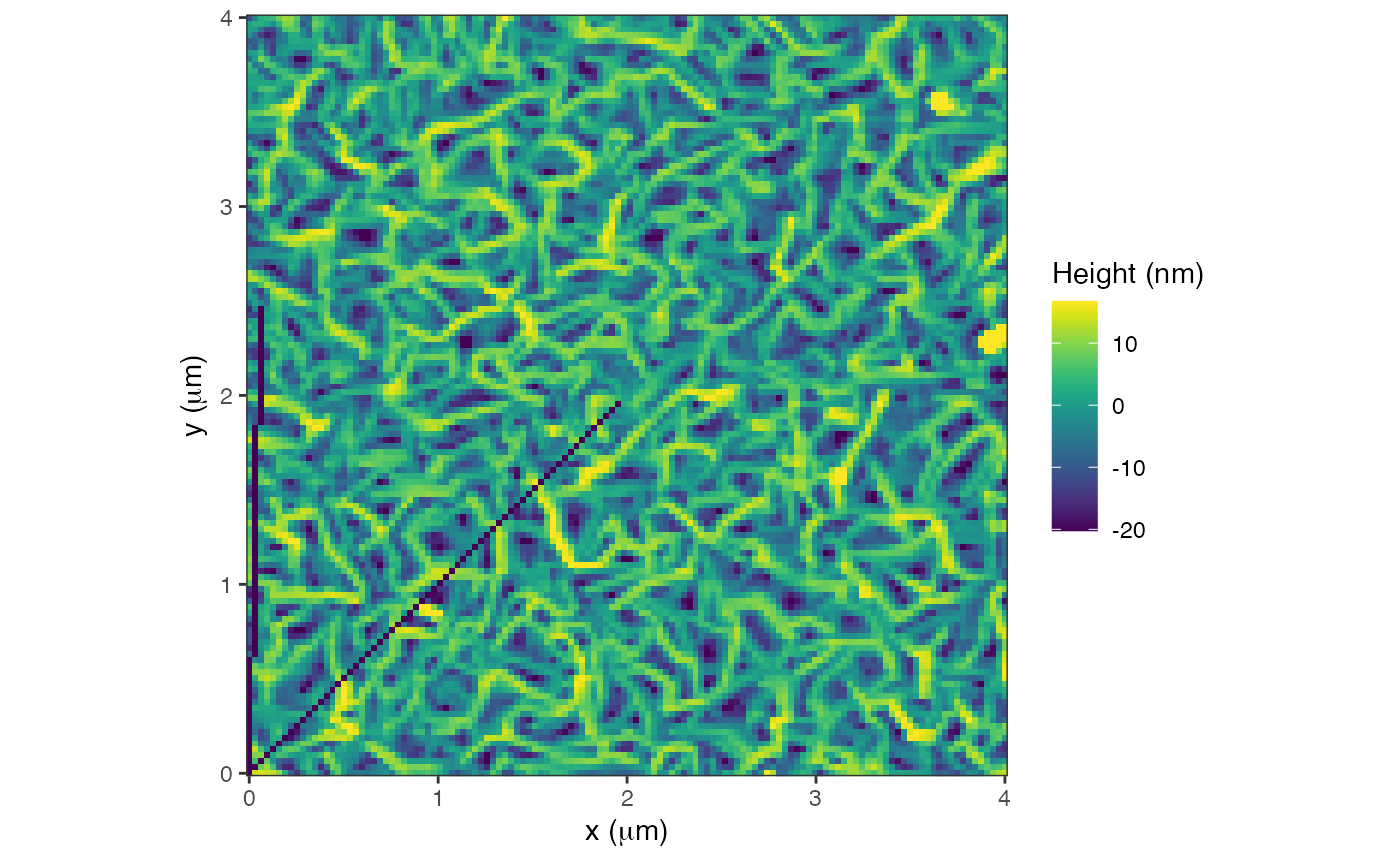
AFM.lineProfile(d, 0,0, 2000,2000) -> d1
AFM.lineProfile(d1, 0,0, 100,2500) -> d2
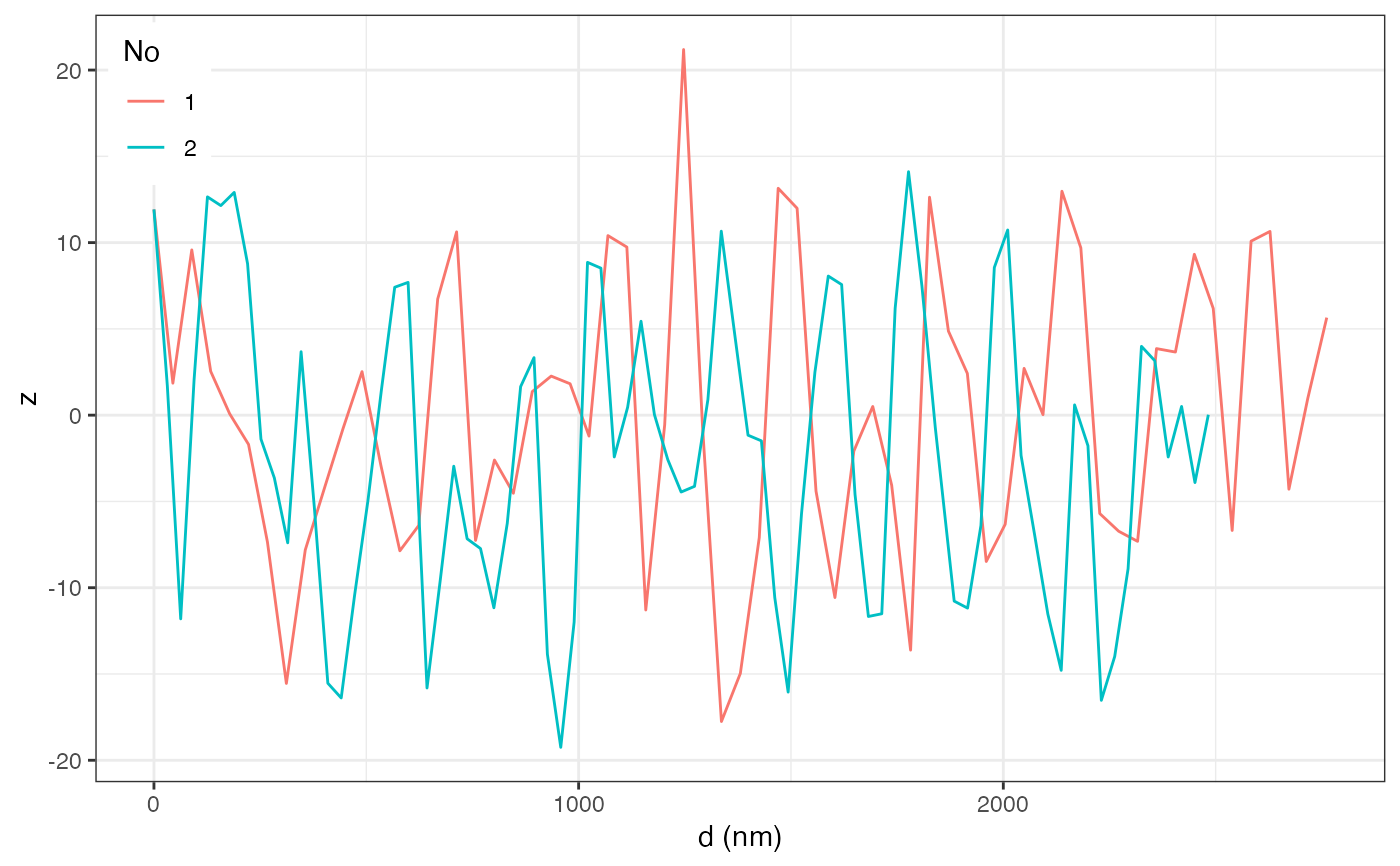
AFM.linePlot(d2)
 plot(d2,addLines=TRUE)
#> Graphing: HeightRetrace
plot(d2,addLines=TRUE)
#> Graphing: HeightRetrace
 head(AFM.linePlot(d2, dataOnly=TRUE))
#> x z type
#> 1 0.00000 11.92384502 1
#> 2 44.54216 1.85193016 1
#> 3 89.08432 9.57862767 1
#> 4 133.62648 2.53822918 1
#> 5 178.16864 0.08543566 1
#> 6 222.71080 -1.69436021 1
head(AFM.linePlot(d2, dataOnly=TRUE))
#> x z type
#> 1 0.00000 11.92384502 1
#> 2 44.54216 1.85193016 1
#> 3 89.08432 9.57862767 1
#> 4 133.62648 2.53822918 1
#> 5 178.16864 0.08543566 1
#> 6 222.71080 -1.69436021 1