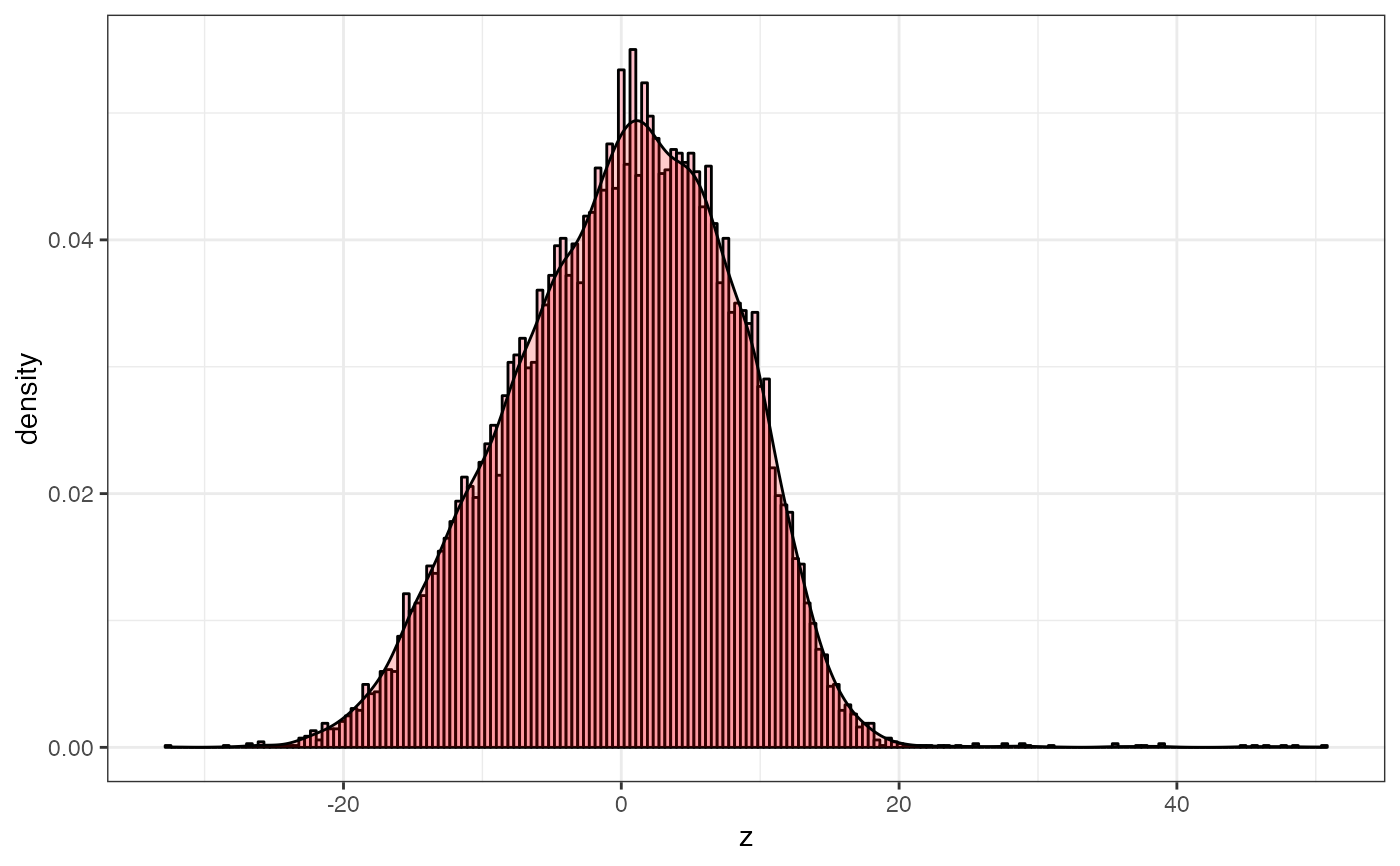
Histogram for the AFMdata object is generated. You can set the number of bins and either output an image or a data table.
AFM.histogram(obj, no = 1, binNo = 200, dataOnly = FALSE)Arguments
- obj
AFMdata object
- no
channel number of the image
- binNo
number of bins in the histogram
- dataOnly
logical, if
TRUEa data frame with the histogram data is returned
Value
data frame or ggplot
See also
Examples
d = AFM.import(AFM.getSampleImages(type='ibw'))
head(AFM.histogram(d, dataOnly=TRUE),n=20)
#>      mids     zDensity
#> 1  -32.25 6.103516e-05
#> 2  -31.75 0.000000e+00
#> 3  -31.25 0.000000e+00
#> 4  -30.75 0.000000e+00
#> 5  -30.25 0.000000e+00
#> 6  -29.75 0.000000e+00
#> 7  -29.25 0.000000e+00
#> 8  -28.75 0.000000e+00
#> 9  -28.25 6.103516e-05
#> 10 -27.75 0.000000e+00
#> 11 -27.25 0.000000e+00
#> 12 -26.75 1.220703e-04
#> 13 -26.25 6.103516e-05
#> 14 -25.75 1.220703e-04
#> 15 -25.25 6.103516e-05
#> 16 -24.75 6.103516e-05
#> 17 -24.25 6.103516e-05
#> 18 -23.75 6.103516e-05
#> 19 -23.25 2.441406e-04
#> 20 -22.75 4.272461e-04
AFM.histogram(d)